Automation Flow Statistics
The Flow Statistics page provides comprehensive analytics and real-time insights into your automation performance, helping you optimize your customer engagement strategies and troubleshoot issues efficiently.
The dashboard is organized into two complementary views to help you analyze different aspects of your automation performance:
Shows how contacts are progressing through the flow and logs any failures.
Displays delivery, open, click-through, and opt-out metrics for all outbound messages.
Note
Flow statistics are available only for active flows. Data is retained and viewable for up to 90 days.
How to View Automation Flow Statistics

Note
You can view statistics for flows that are Active or Paused.
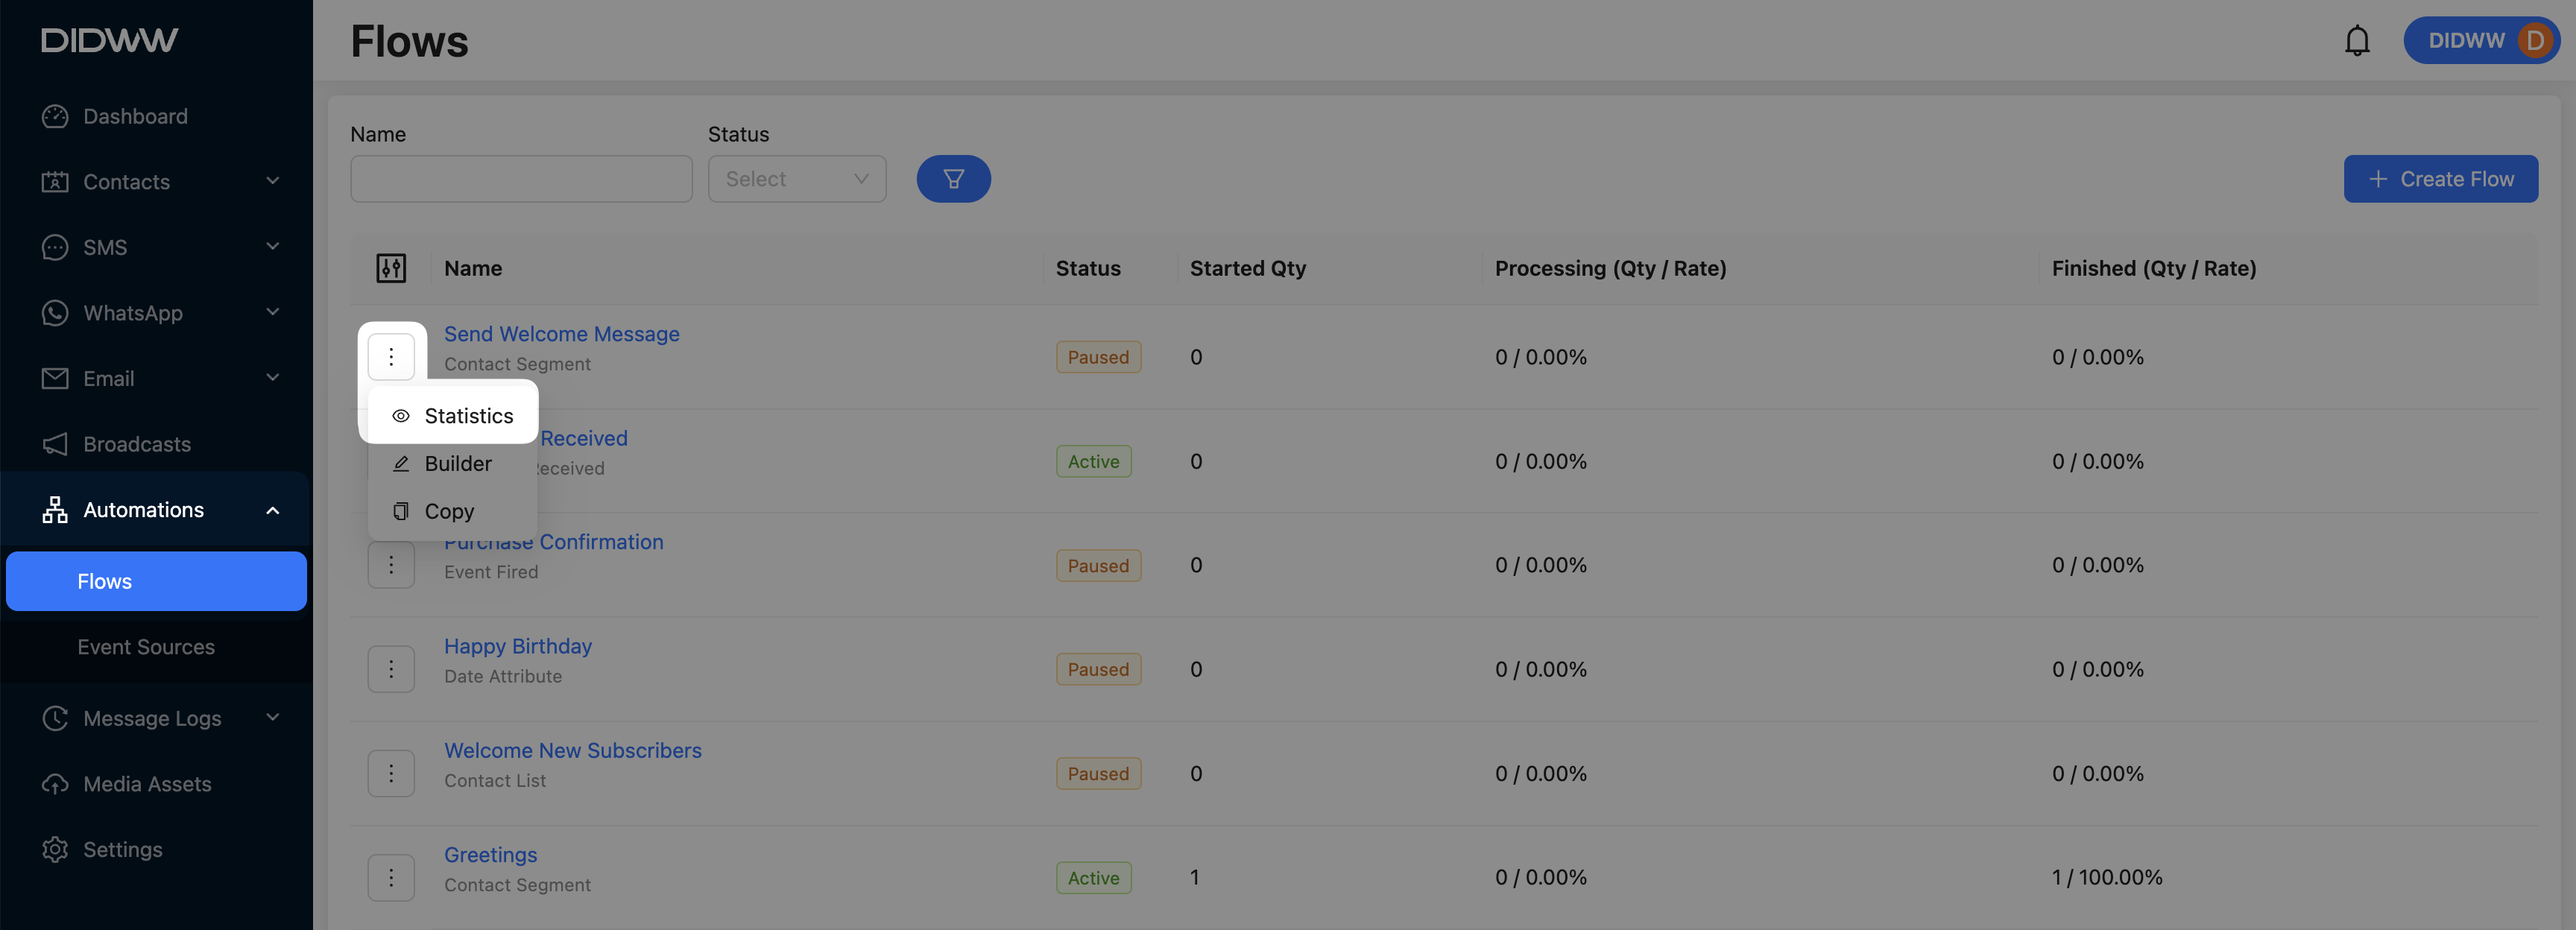
Fig. 6. How to View Automation Flow Statistics.
Processing Flow Statistics
The Processing tab under Flow Statistics provides a real-time overview of contact progression through an active flow.
Track your contacts’ journey through each automation step with real-time metrics—identify bottlenecks, spot failure points, and optimize flow performance to ensure smooth customer experiences and accurate workflow execution.
Flow Processing Metrics
These statistics summarize the number of contacts at different stages of the flow.
Status
Description
Started
The total number of unique contacts that have entered the flow.
Processing
The number and percentage of contacts currently active within the flow.
Finished
The number and percentage of contacts that have completed all steps in the flow.
Failed Logs
The Failed Logs section shows records of failed processing events that occurred while contacts were moving through the flow. These logs help identify where and why a contact could not successfully complete a step.
Field
Description
Contact
Identifier of the contact for whom the failure occurred.
Step
The specific flow step where the failure was encountered.
Error
A description or message indicating the cause of the failure.
Timestamp
The exact date and time the failure was recorded.
Messaging Flow Statistics
The Messaging tab under Flow Statistics provides detailed insights into how messages performed across different communication channels.
Analyze the effectiveness of your communication strategy through comprehensive engagement metrics—monitor delivery rates, track open and click-through percentages, measure opt-out activity, and identify message failures to better understand overall performance.
Message Engagement Metrics
The following metrics summarize recipient interaction with automation flow messages.
Metric
Description
Delivery Rate
Percentage of messages that were successfully delivered, based on the number of messages sent.
For example: 2 of 2 delivered (100.00%).Open Rate
Percentage of delivered messages that were opened by recipients.
This metric is not applicable to SMS.Click-Through Rate
Percentage of delivered messages where recipients clicked at least one tracked link.
Unique Clicks: Number of individual recipients who clicked a link (only counted once per recipient).
Total Clicks: Total number of clicks across all recipients, including multiple clicks on the same link.Opt-Out Rate
Percentage of delivered messages that resulted in recipients unsubscribing.
This includes the count and rate of opt-outs relative to total delivered messages.
Flow Breakdown Metrics
The Flow Breakdown metrics provides a detailed view of how your messages are performing across delivery, open, click-through, and opt-out metrics—broken down by communication channel.
Displays the number and percentage of messages delivered per channel, based on the configured Primary and any Fallback messaging channels in the flow.
Note
The channels and corresponding delivery metrics vary depending on the messaging configuration in the flow builder.
Channel
Description
SMS (Primary)
Shows the number and percentage of successfully delivered SMS messages (e.g., 1 of 1, 100.00%).
Email (Fallback 1)
Displays the fallback Email delivery count and percentage when SMS delivery fails.
Undelivered
Indicates the total number and percentage of messages that were not delivered across any channel.
Displays the number and percentage of messages opened per supported channel. Open tracking applies only to channels that support it, such as Email, and excludes channels like SMS.
Note
The “Open” status is not available for SMS messages due to channel limitations.
Channel
Description
SMS (Primary)
SMS messages do not support open tracking.
Email (Fallback 1)
Shows how many fallback emails were opened and their percentage (e.g., 2 of 4, 50.00%).
Not opened
Represents the number and percentage of fallback emails that were delivered but not opened.
Displays the number and percentage of messages with at least one tracked link clicked, per supported messaging channel. Metrics are available only when link tracking is enabled in the message settings.
Note
To enable this rate calculation, ensure link tracking is active in your message settings.
Channel
Description
SMS (Primary)
Displays the amount and percentage of SMS messages where recipients clicked a tracked link.
Email (Fallback 1)
Indicates the number and rate of link clicks in fallback Email messages.
Not clicked
Shows how many recipients did not click any links in the sent messages.
Displays the number and percentage of recipients who unsubscribed from receiving messages, segmented by channel. Metrics are shown only for channels where opt-out tracking is enabled.
Note
To enable this rate calculation, make sure opt-out tracking is active.
Channel
Description
SMS (Primary)
Shows how many recipients unsubscribed from receiving SMS messages, along with the opt-out percentage.
Email (Fallback 1)
Indicates the number and percentage of users who unsubscribed from fallback Email communications.
Channel-Specific Message Metrics
Note
Channel-specific metrics are displayed based on the messaging channels configured in the flow builder:
If you have added and configured SMS Messaging, the SMS Channel Metrics section will appear.
If you have configured Email, the Email Channel Metrics section will appear.
If WhatsApp is added to the flow, you will see WhatsApp Channel Metrics.
If all three channels are used in the flow, metrics for SMS, Email, and WhatsApp will be shown separately under their respective sections.
The following table defines each metric used to evaluate the performance of messages sent through automation flows.
Metric
Description
Delivery
Total number of messages sent and successfully delivered. Includes a percentage (e.g., 2 of 4 delivered (50.00%)).
Opens
Number and percentage of messages opened by recipients.
Open metric is not supported for SMS and WhatsApp channels.
Click Throughs
Number and percentage of messages where recipients clicked a tracked link.
Requires link tracking to be enabled.
Opt-Outs
Number and percentage of recipients who unsubscribed from receiving messages.
Failed
Number and percentage of messages that failed to send or deliver due to issues like invalid addresses or delivery errors.
Additional Resources
Learn how to access, manage, and create automation flows.
Understand how actions and rules define the logic of an automation flow once a trigger condition is met.