DIDWW Prometheus Exporter
The DIDWW Prometheus exporter is a service that provides access to metrics and account information for monitoring and alerts. Once configured, it allows you to track various statistics related to your DIDWW account.

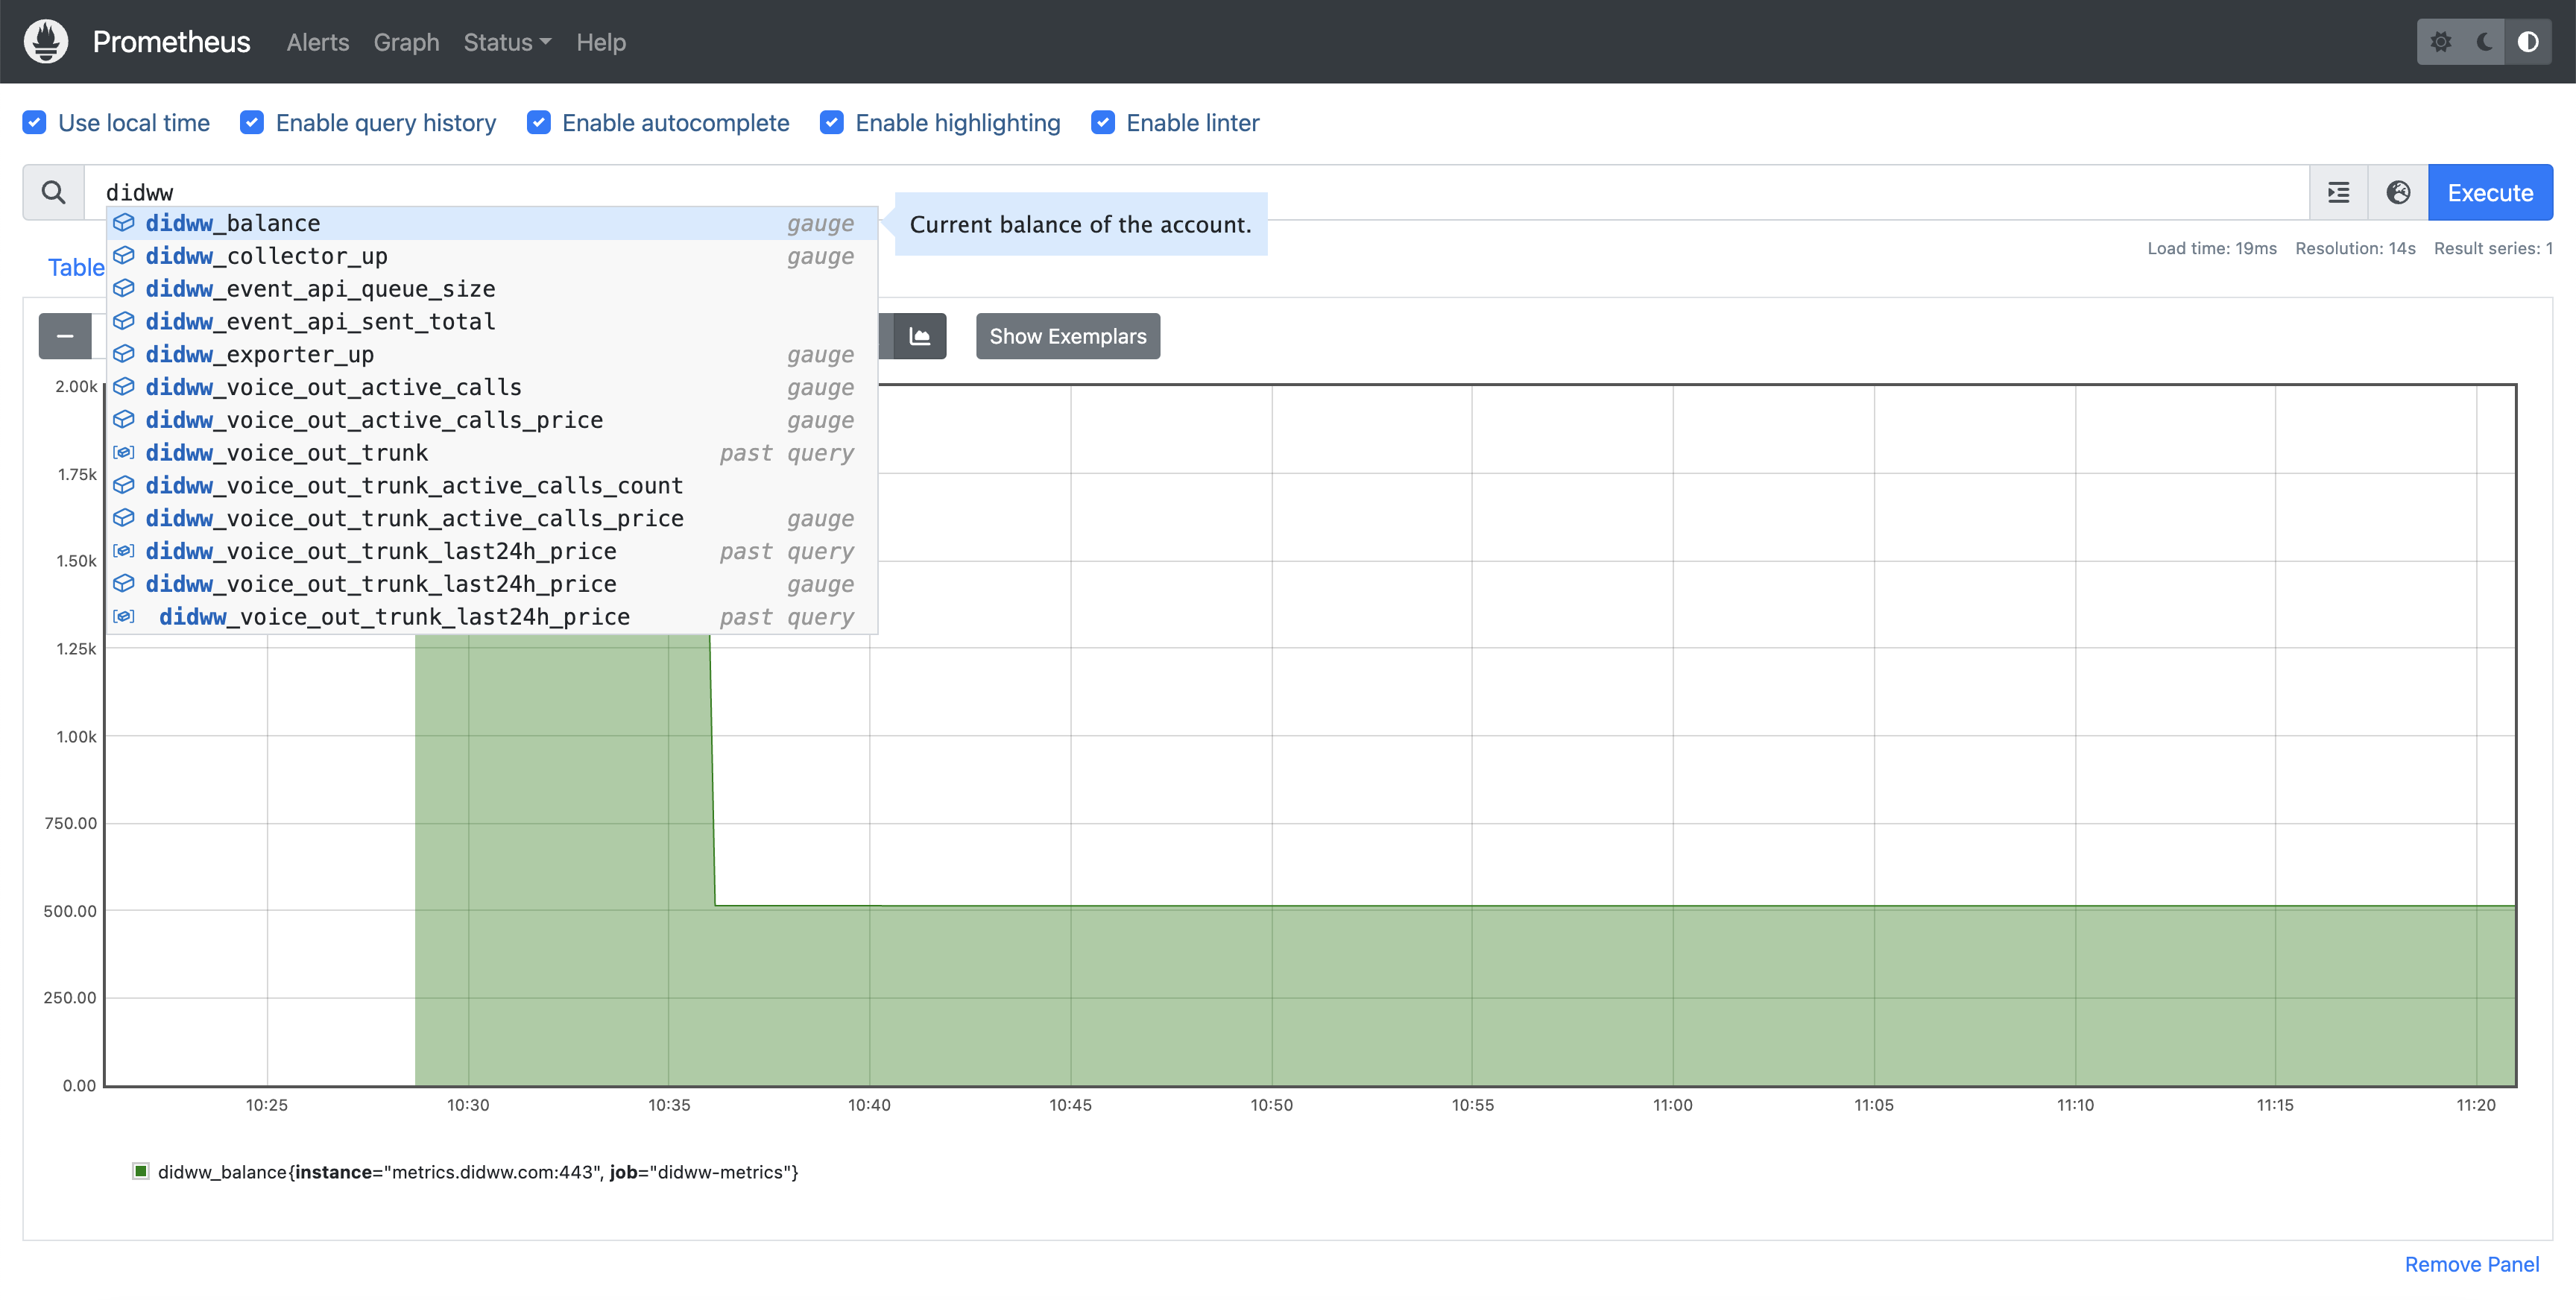
Fig. 1. DIDWW Prometheus Exporter Graph Example And List of Metrics
Supported Metrics
The DIDWW Prometheus exporter provides several metrics to monitor your account’s status and usage.
Nr. |
Name |
Description |
|---|---|---|
1 |
Indicates whether the DIDWW exporter is operational (1 if up, 0 if down). |
|
2 |
Indicates whether the collector is operational (1 if up, 0 if down). |
|
3 |
Shows the current balance of the account. |
|
4 |
Number of concurrent outbound calls on the account, measured every minute. |
|
5 |
Cost of active outbound calls on the account, updated every minute. |
|
6 |
Number of concurrent outbound calls via the trunk, measured every minute. |
|
7 |
Cost of active outbound calls via the trunk, updated every minute. |
|
8 |
Total cost of outbound calls completed via the trunk in the last 24 hours. |
|
9 |
Current size of the event API queue. |
|
10 |
Total number of events sent via the event API. |
|
11 |
Count of received responses for each HTTP status code. |
Metric Details & Usage Example
1. didww_exporter_up
Indicates the operational status of the DIDWW exporter. A value of 1 signifies that the exporter is up and running, while 0 indicates it is down.
Sample Output:
didww_exporter_up 1Usage Example: Monitor this metric to ensure the exporter is functioning correctly. Configure an alert to notify if the value drops to
0, indicating a potential issue with the exporter.
2. didww_collector_up
Reflects the status of individual collectors within the exporter. Each collector gathers specific data; a value of 1 means the collector is operational, while 0 indicates it is not.
Sample Output:
didww_collector_up{collector="event_api"} 1
didww_collector_up{collector="voice_out"} 1
Usage Example: Use this metric to verify that all collectors are active. If a collector’s value is
0, it may require investigation to restore functionality.
3. didww_balance
Displays the current balance of your DIDWW account in USD currency.
Sample Output:
didww_balance 150.75Usage Example: Track this metric to monitor your account balance. Set up alerts to notify when the balance falls below a specified threshold to ensure uninterrupted service.
4. didww_voice_out_active_calls
Indicates the number of concurrent outbound calls from your account, measured every minute.
Sample Output:
didww_voice_out_active_calls 5Usage Example: Monitor this metric to track your outbound call volume. It helps in capacity planning and identifying unusual spikes in call activity.
5. didww_voice_out_active_calls_price
Shows the total cost of active outbound calls from your account, measured every minute.
Sample Output:
didww_voice_out_active_calls_price 12.50Usage Example: Track this metric to monitor real-time spending on outbound calls. It aids in budgeting and cost management.
6. didww_voice_out_trunk_active_calls_count
Represents the number of concurrent outbound calls through a specific trunk, measured every minute.
Sample Output:
didww_voice_out_trunk_active_calls_count{trunk="voice_out_trunk_name_1"} 3
didww_voice_out_trunk_active_calls_count{trunk="voice_out_trunk_name_2"} 2
Usage Example: Use this metric to assess the load on individual trunks. It assists in balancing traffic and optimizing trunk usage.
7. didww_voice_out_trunk_active_calls_price
Displays the total cost of active outbound calls through a specific trunk, measured every minute.
Sample Output:
didww_voice_out_trunk_active_calls_price{trunk="voice_out_trunk_name_1"} 7.50
didww_voice_out_trunk_active_calls_price{trunk="voice_out_trunk_name_2"} 5.00
Usage Example: Monitor this metric to understand the cost distribution across different trunks. It helps in financial analysis and cost optimization.
8. didww_voice_out_trunk_last24h_price
Shows the total cost of all outbound calls completed through a specific trunk in the last 24 hours.
Sample Output:
didww_voice_out_trunk_last24h_price{trunk="voice_out_trunk_name_1"} 100.00
didww_voice_out_trunk_last24h_price{trunk="voice_out_trunk_name_2"} 80.00
Usage Example: Use this metric for daily cost assessments per trunk. It aids in identifying trends and making informed decisions regarding trunk usage.
9. didww_event_api_queue_size
Indicates the current size of the event API queue.
Sample Output:
didww_event_api_queue_size 42Usage Example: This metric is useful for monitoring the event processing backlog. A growing queue size can indicate processing delays or issues with event handling.
10. didww_event_api_sent
Shows the total number of events successfully sent.
Sample Output:
didww_event_api_sent 10500Usage Example: This metric is helpful for tracking the volume of events sent over time, allowing you to gauge system activity and throughput.
11. didww_event_api_responses
Displays the number of responses received, categorized by HTTP status code.
Sample Output:
didww_event_api_responses{status_code="200"} 9800
didww_event_api_responses{status_code="404"} 15
didww_event_api_responses{status_code="500"} 5
Usage Example: Use this metric to monitor event API response success and error rates. It helps in identifying response trends, such as frequent errors, that may require further investigation.
Visualizing Metrics
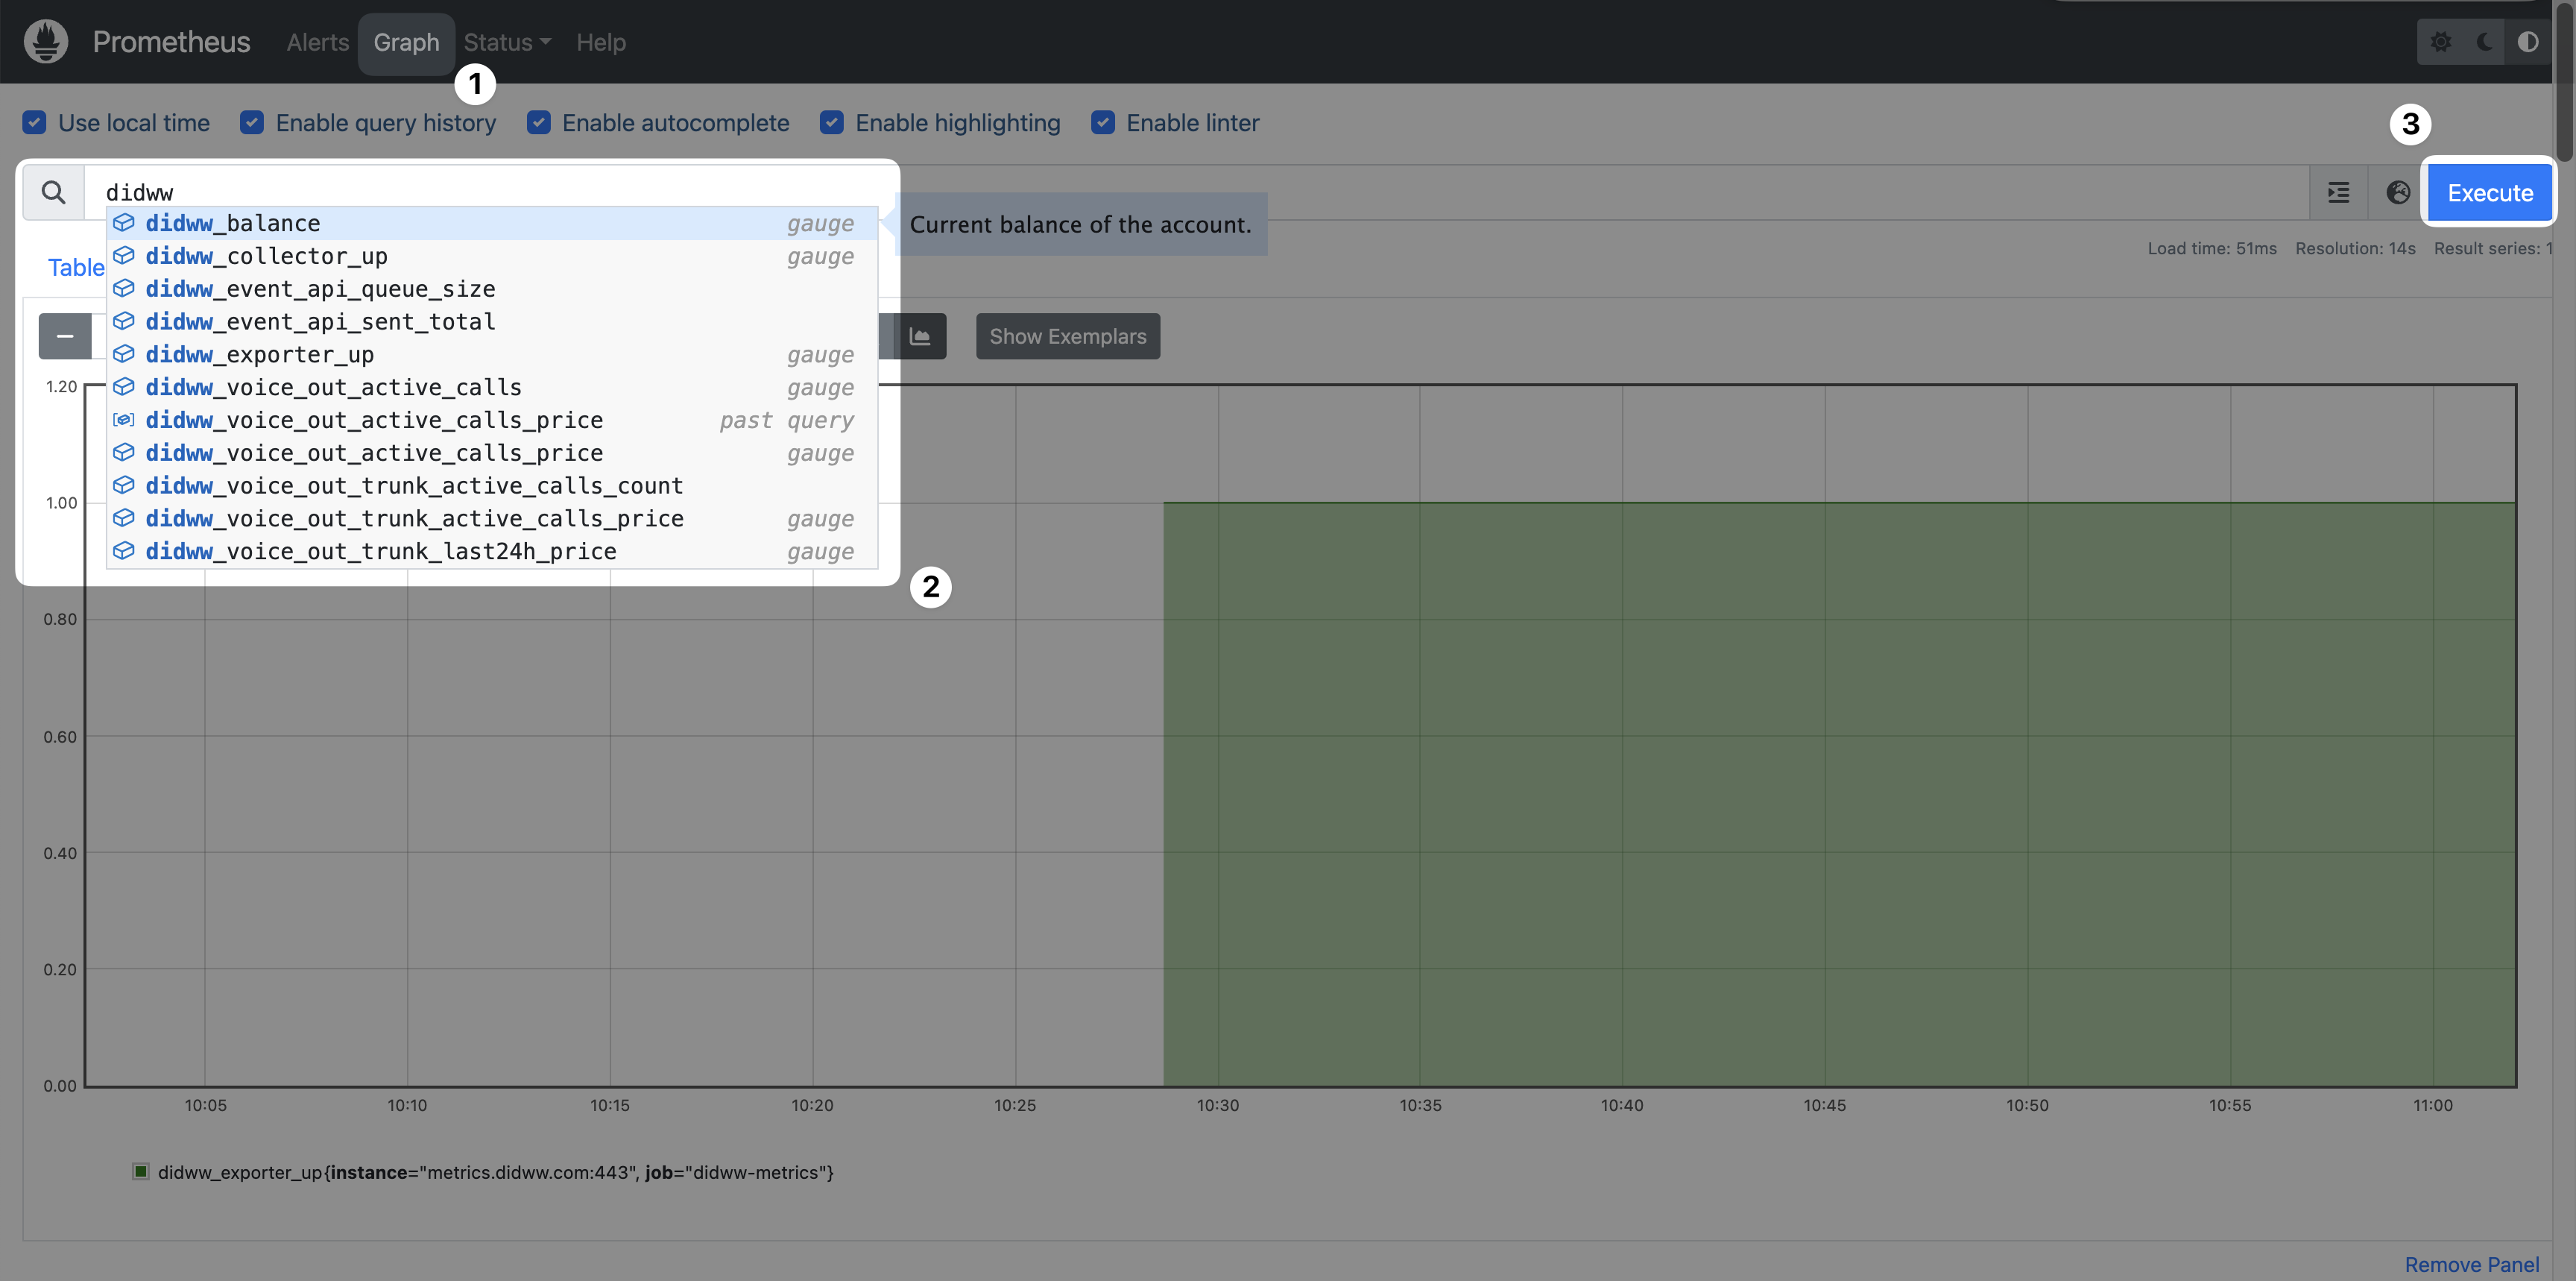
To visualize metrics, you can use Prometheus’s built-in expression browser by selecting Graph from the top menu, entering an expression, and clicking Execute to display results as a graph or table. Alternatively, you can integrate Prometheus with a visualization tool such as Grafana. For additional guidance on setting up visualizations, refer to the Prometheus Visualization documentation .

Fig. 3. Visualizing Graphs in Prometheus
Setup and Configuration
To start using the DIDWW Prometheus exporter, follow these steps:
1. Install the Prometheus Server
Ensure that the Prometheus server is installed and operational. Installation instructions are available on the Prometheus website .
2. Get an API Security Key
Generate a dedicated API security key for your Prometheus server in your DIDWW account. For enhanced security, it is highly recommended to set the Access IPs field to your Prometheus server’s IP address. See the API section for instructions on obtaining an API key.
To verify connectivity between your Prometheus server and the DIDWW Prometheus exporter, use the following curl command (replacing <API_KEY> with your actual API key):
curl -m 10 -sSv -H 'Authorization: Bearer <API_KEY>' https://metrics.didww.com/metrics
3. Configure the Prometheus Server
Add the following job configuration to your prometheus.yml file:
- job_name: didww-metrics
  scrape_interval: 30s
  scrape_timeout: 10s
  # honor_timestamps must not be "false"
  honor_timestamps: true
  scheme: https
  authorization:
     credentials: "<API_KEY>"
  static_configs:
    - targets:
        - metrics.didww.com:443
Note
Replace <API_KEY> with the API key obtained from your DIDWW account.
4. Save the Settings and Restart Prometheus
After configuring Prometheus, save the configuration file and restart the Prometheus service using the appropriate command. For example, if you’re using Homebrew services, restart Prometheus with:
brew services restart prometheus
Once Prometheus is running, open the web interface by navigating to, for example, http://<yourhostnameaddress>:9090 in your web browser. You should see this target available on the Status -> Targets page. If the connection is successful, the State will display as Up.
Note
If any issues arise, check the Prometheus log file for debugging. Common log file locations include:
/var/log/prometheus/prometheus.log on Linux systems
/usr/local/var/log/prometheus.log on macOS
A custom path specified in your Prometheus configuration file

Fig. 2. DIDWW Prometheus Exporter Target Connected