Statistics#
Statistics allow you to view different graphs that reflect the performance of your Voice and SMS traffic.
Voice IN#
To analyze your inbound call performance, use the various metrics and filters available in the ‘Voice IN’ tab.
Fig. 1. Voice IN Tab.#
Metrics#
Metric |
Description |
|---|---|
Concurrent Calls |
Displays active calls, updated every minute. Note: Very short calls may not be counted. |
ACD (Average Call Duration) |
Shows the average duration of calls, calculated by dividing the total call time by the number of successful calls for each interval. |
ASR (Answer-Seizure Ratio) |
Represents the percentage of successful calls out of all call attempts for each interval. Interval length is determined by your “Group By” settings. |
Total Call Count |
Indicates the number of calls sent to customers, calculated per interval defined by the “Group By” settings. |
Total Call Duration (Minutes) |
Displays the total duration of calls sent to customers, calculated per interval based on the “Group By” settings. |
Total Cost |
Shows the aggregated cost of calls for each interval. |
Available Filters#
Filter |
Description |
|---|---|
Timeframe |
Filters charts by the selected timeframe (options: 24 hours, 7 days, 30 days, 60 days, 90 days). |
DID Number |
Filters charts by the selected DID number. |
DID Country |
Filters charts by the selected country. |
Voice IN Trunk |
Filters charts by the selected Voice IN trunk. |
Trunk Group |
Filters charts by the selected trunk group. |
Type |
Filters charts by the selected type (options: PSTN, Toll-free, Metered Channels, CNAM Lookup). |
Voice OUT#
To analyze your outbound call performance, use the various metrics and filters provided in the ‘Voice OUT’ tab.
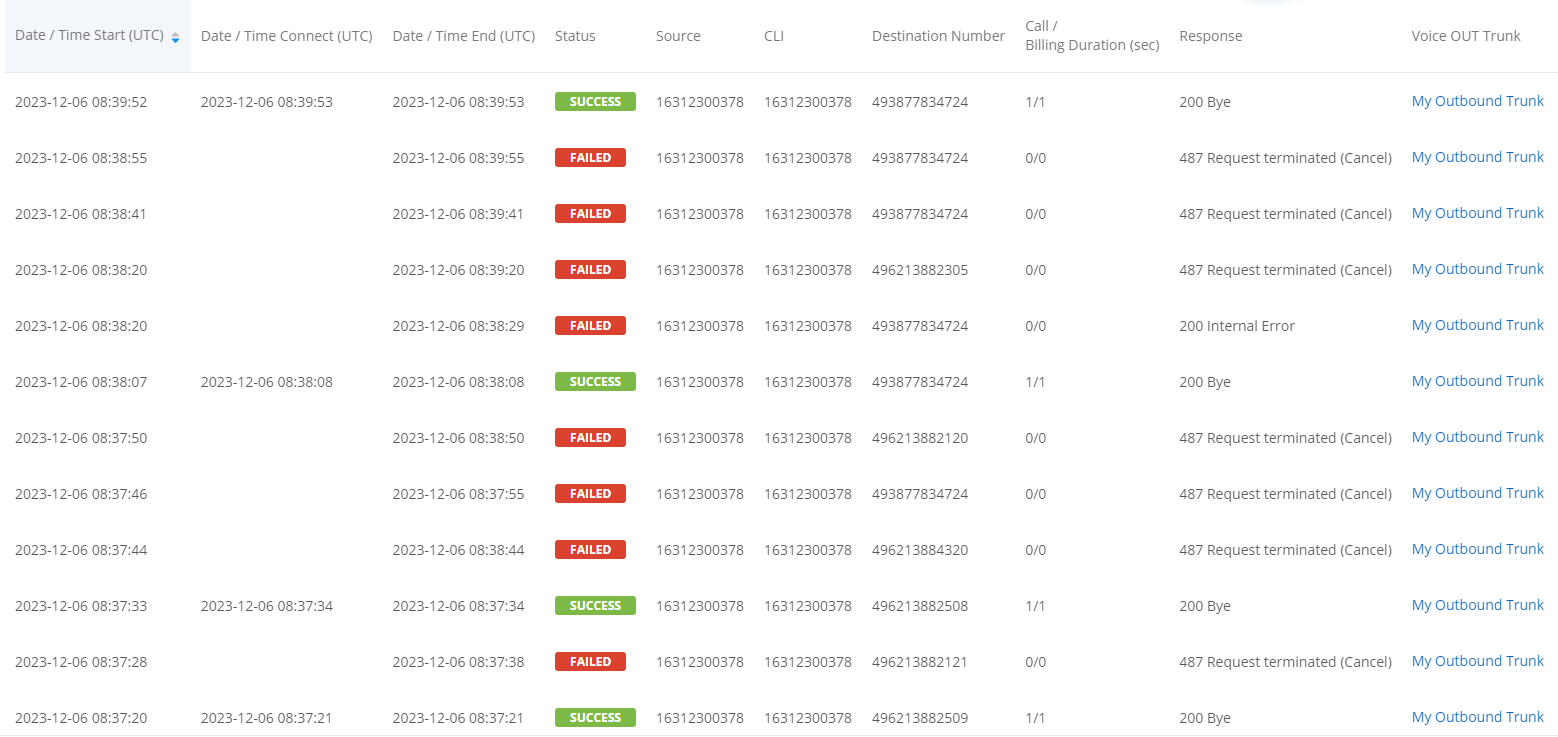
Fig. 2. Voice OUT Tab.#
Metrics#
Metric |
Description |
|---|---|
Concurrent Calls |
Displays active calls, with data measured once per minute. Note: Some short calls may not be counted. |
ACD (Average Call Duration) |
Shows the average call duration, calculated by dividing the total call time by the number of successful calls for each interval. |
ASR (Answer-Seizure Ratio) |
Represents the percentage of successful calls out of all call attempts for each interval. Interval length depends on the “Group By” settings. |
Total Call Count |
Indicates the number of calls received from the customer, calculated per interval defined by the “Group By” settings. |
Total Call Duration (Minutes) |
Shows the total duration of calls received from the customer, calculated per interval based on the “Group By” settings. |
Total Cost |
Represents the aggregated cost of calls for each interval. |
Available Filters#
Filter |
Description |
|---|---|
Timeframe |
Filters charts by the selected timeframe (options: 24 hours, 7 days, 30 days, 60 days, 90 days). |
Destination Country |
Filters charts by the selected destination country. |
Voice OUT Trunk |
Filters charts by the selected Voice OUT trunk. |
Call Type |
Filters charts by the selected call type (options: International, Origin based, Local, Emergency). |
P-Charge-Info |
Filter charts by the p-charge-info header. Learn more about the P-Charge-Info header. |
SMS IN#
To analyze your inbound SMS performance, use the various metrics and filters provided in the ‘SMS IN’ tab.
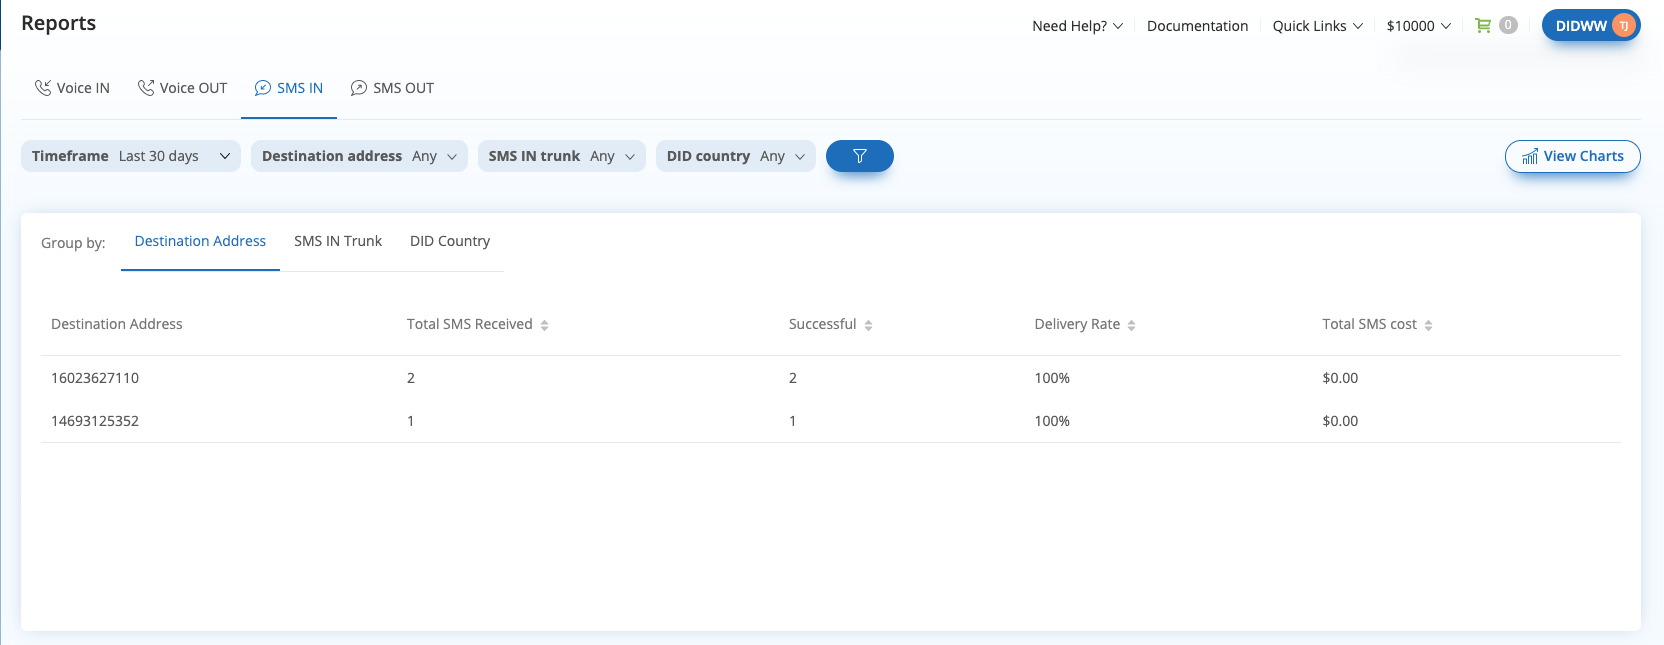
Fig. 3. SMS IN Tab.#
Metrics#
Metric |
Description |
|---|---|
Total SMS Received |
Represents the count of SMS messages received by the customer within the SMS IN service, calculated for each interval as defined in the “Group By” setting. |
Total SMS Cost |
Represents the total cost of SMS messages received by the customer within the SMS IN service, calculated for each interval as defined in the “Group By” setting. |
Delivery Rate (%) |
The percentage of successfully delivered messages out of the total messages, calculated for each interval as defined in the “Group By” setting. |
Available Filters#
Filter |
Description |
|---|---|
Timeframe |
Filters charts by the selected timeframe (options: 24 hours, 7 days, 30 days, 60 days, 90 days). |
Destination Address |
Filters charts by the selected destination address. |
SMS IN Trunk |
Filters charts by the selected SMS IN trunk. |
DID Country |
Filters charts by the selected DID country. |
SMS OUT#
To analyze your outbound SMS performance, use the various metrics and filters provided in the ‘SMS OUT’ tab.
Fig. 4. SMS OUT Tab.#
Metrics#
Metric |
Description |
|---|---|
Total SMS Sent |
Represents the count of SMS messages sent by the customer using the SMS OUT service, calculated for each interval as defined in the “Group By” setting. |
Total SMS Cost |
Represents the cost of SMS messages sent by the customer using the SMS OUT service, calculated for each interval as defined in the “Group By” setting. |
Delivery Rate (%) |
The percentage of successfully delivered messages out of the total messages sent, calculated for each interval as defined in the “Group By” setting. |
Available Filters#
Filter |
Description |
|---|---|
Timeframe |
Filters charts by the selected timeframe (options: 24 hours, 7 days, 30 days, 60 days, 90 days). |
Source Address |
Filters charts by the selected source address. |
Destination Address |
Filters charts by the selected destination address. |
SMS OUT Trunk |
Filters charts by the selected SMS OUT trunk. |
Destination Country |
Filters charts by the selected destination country. |
Service Type |
Filters charts by the selected service type (options: A2P, P2P). |
SMS Campaign |
Filters charts by the selected SMS campaign. This filter activates if the A2P service type is selected. |
Capacity Groups#
To monitor the usage and performance of your voice services, use the metrics and visual indicators available in the Capacity Groups tab.
Fig. 5. Capacity groups tab.#
Metrics#
Metric |
Description |
|---|---|
Total Failed Calls |
Indicates the total number of failed calls during the selected timeframe. Failures may occur due to capacity limits being reached or incorrect configuration. |
Concurrent Calls |
Data is sampled at one-minute intervals, providing granular visibility into usage patterns. |
Capacity Exceeded |
Shows the number of capacity breach events where the defined channel limit was surpassed during the selected timeframe. A non-zero value indicates that the current capacity configuration may be insufficient for peak traffic periods. |
Available Filters#
Filter |
Description |
|---|---|
Timeframe |
Filters the data by the selected period. Options include 24 hours, 7 days, 30 days, 60 days, and 90 days. |
Capacity Group |
Allows filtering by a specific capacity group. Only data associated with the selected group will be displayed in the charts. |