Services & Tools
Development Tools
Integrations
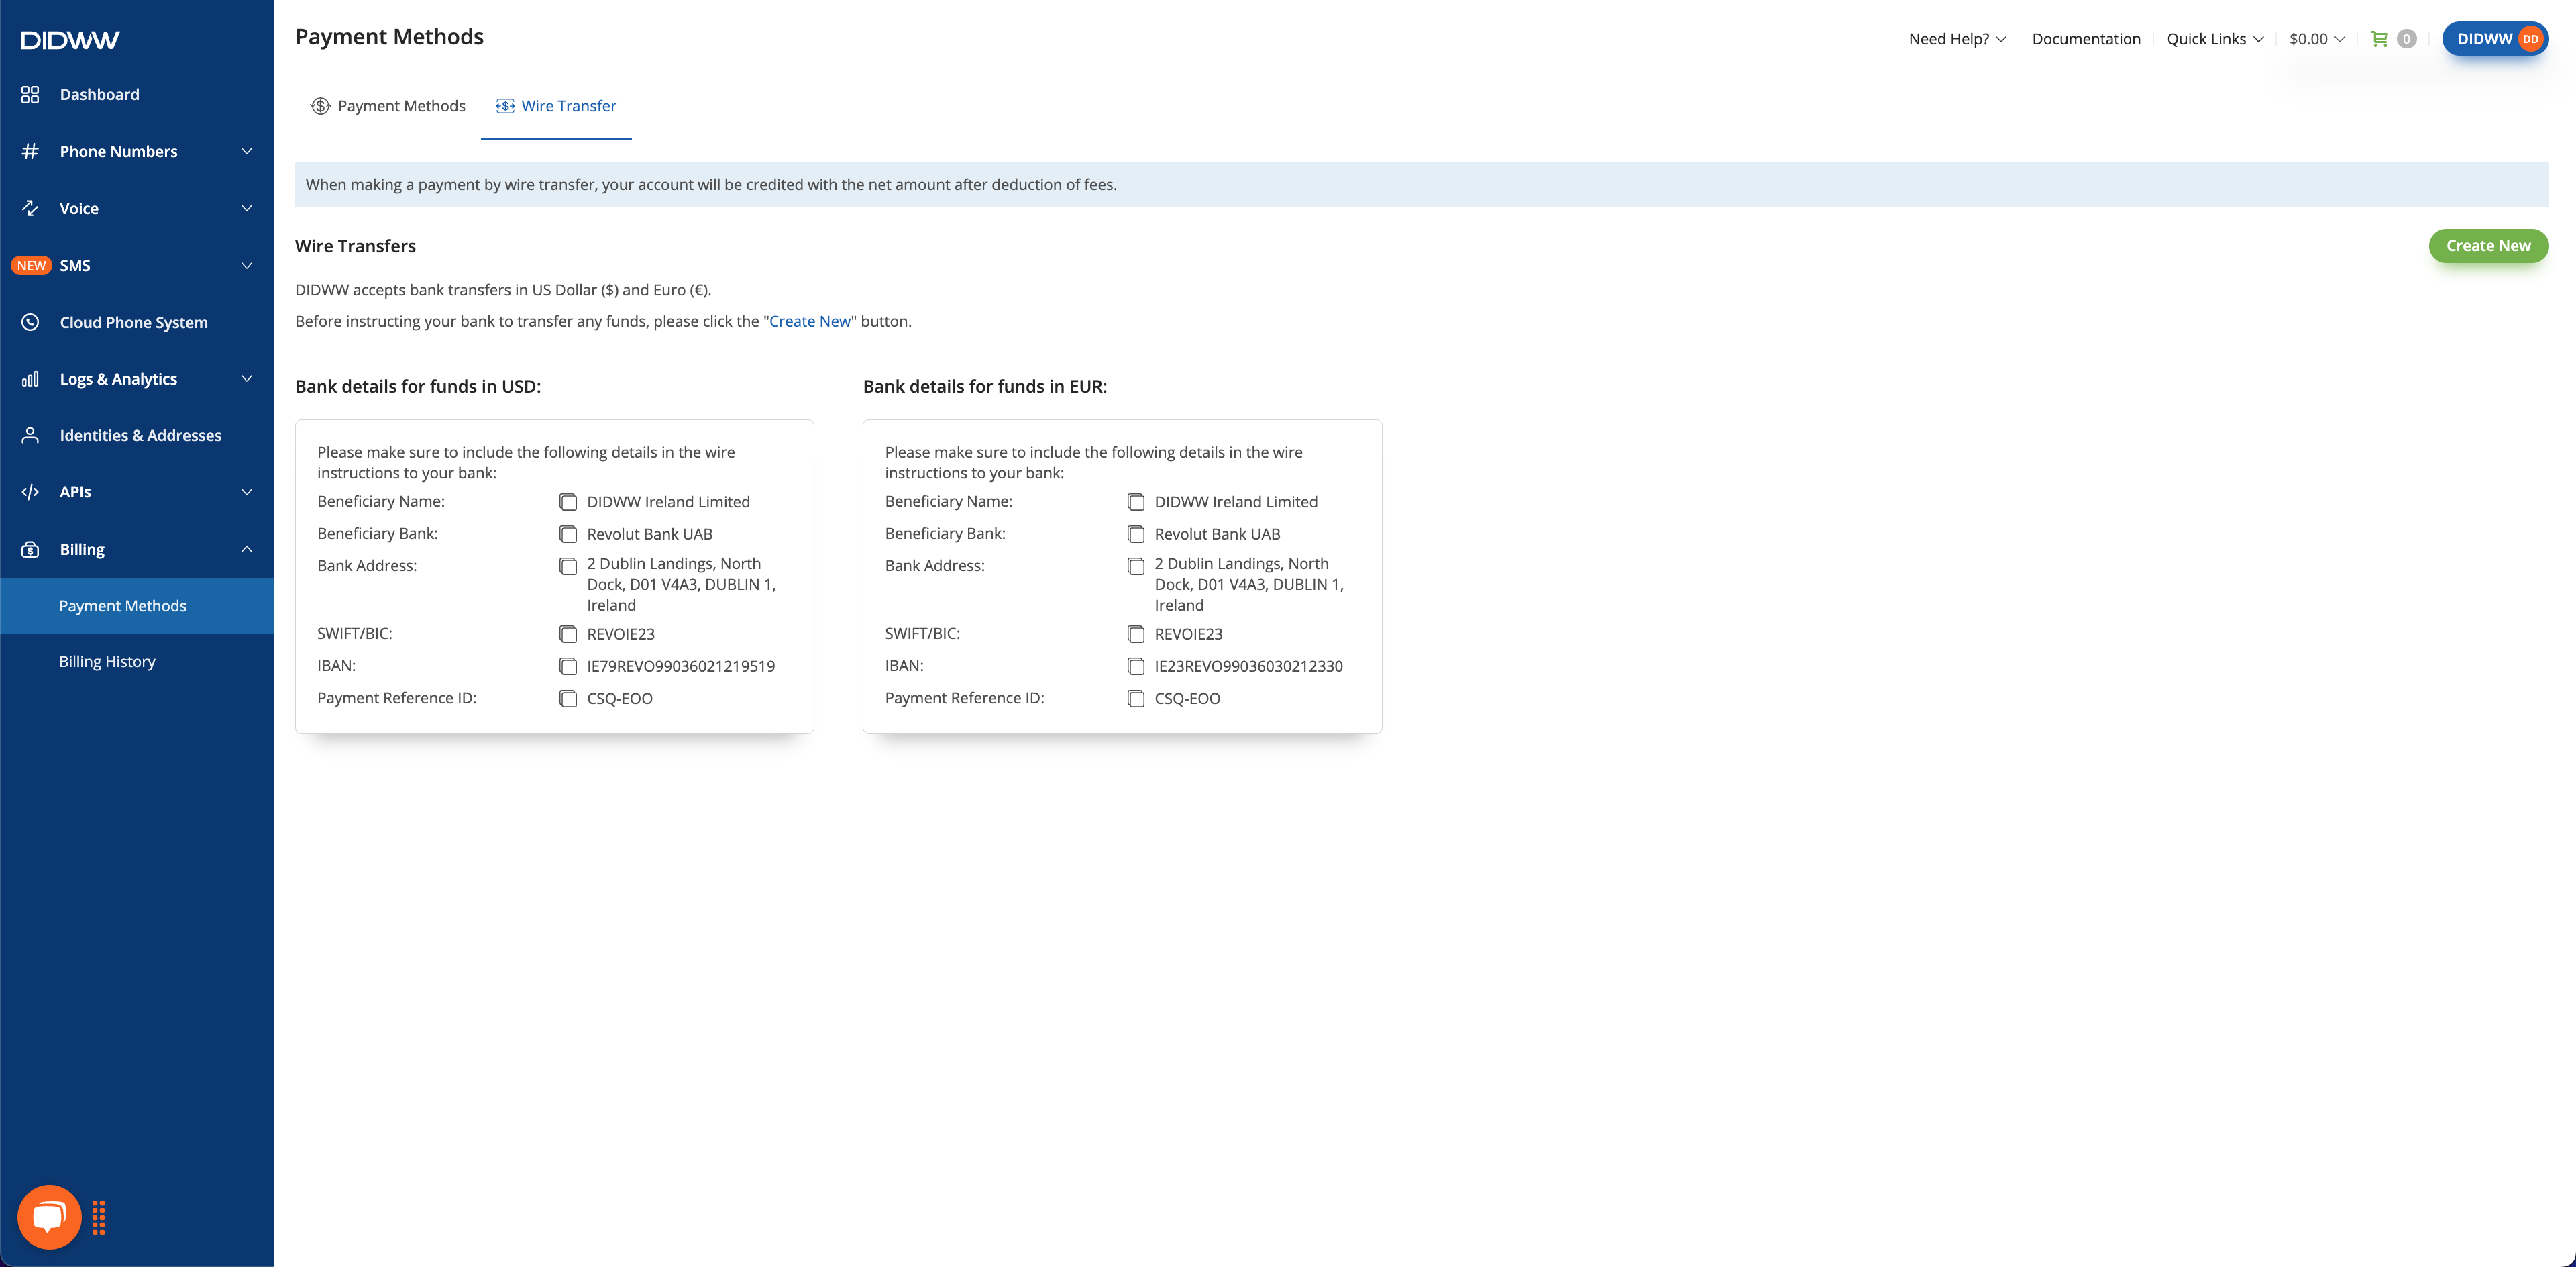
The “Reports” subsection displays the latest information regarding payments, orders, invoices and prepaid balances (Fig. 1).
Fig. 1. “Reports” subsection.